Durango Bill’s
Debunking the Deniers of Global Warming
Global Warming Denial
Liars
New Zealand’s Franz Josef Glacier
New Zealand’s Largest Glacier - The Tasman Glacier
Mt. Rainier’s Nisqually Glacier
Norway’s Briksdal Glacier
and a
Global Warming Denial Liar
The Ice Age Now Website - run by Robert Felix
Typical tactics of the Global Warming Deniers include outright lies. The Ice Age Now website claims that many glaciers are growing/expanding. We will look at several of the glaciers that they claim are growing, and show that they are in reality - shrinking.
 New Zealand’s Franz
Josef Glacier is a good case study of the ongoing retreat of
world glaciers as opposed to the claims of the Global Warming
Deniers that the world’s glaciers are advancing. The Print
Screen images to the right and below illustrate the typical
false claims of the Global Warming Deniers.
New Zealand’s Franz
Josef Glacier is a good case study of the ongoing retreat of
world glaciers as opposed to the claims of the Global Warming
Deniers that the world’s glaciers are advancing. The Print
Screen images to the right and below illustrate the typical
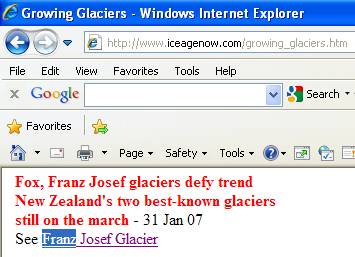
false claims of the Global Warming Deniers.The Ice Age Now website ( http://www.iceagenow.com/ - run by Robert Felix) claims that the Franz Josef Glacier is increasing in size. The website includes the Franz Josef Glacier in its list of “Growing Glaciers”. (Please see the Print Screen image at right.)
The Ice Age Now website even has a web page devoted to the Franz Josef Glacier where they state that the glacier has “continued advancing down” its valley.
If you were to believe the Ice Age Now website, you would be led to believe that there never has been any recent retreat of the Franz Josef Glacier. This is what they want you to believe.
There is no mention that the Franz Josef Glacier has actually shrunk by more than one mile since the 1920’s.
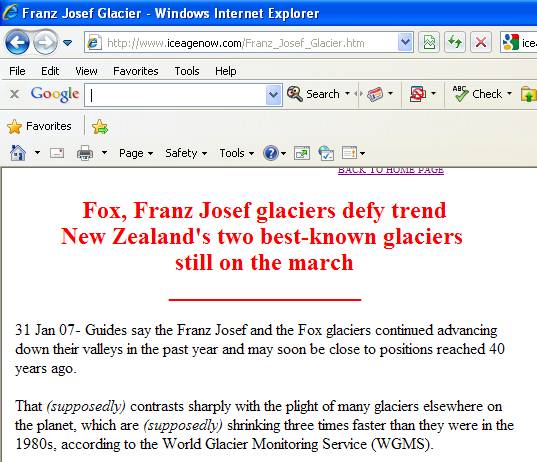
As documented below, the Franz Josef Glacier has retreated more than one mile since the 1920s.
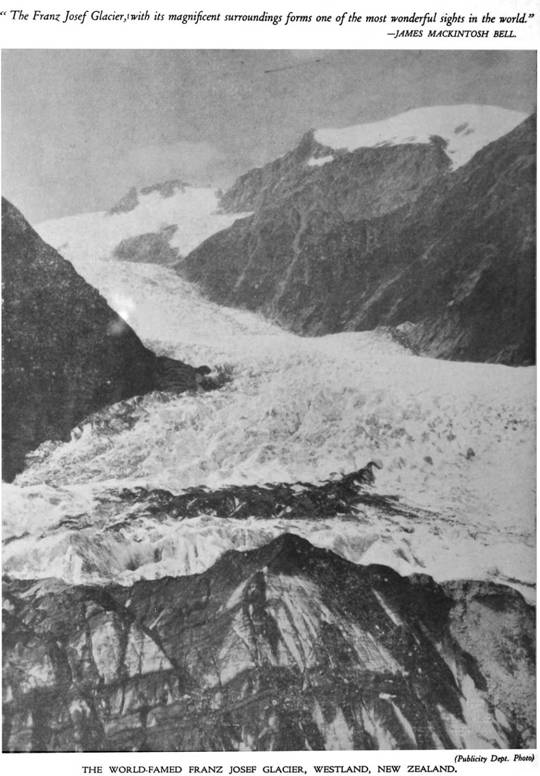
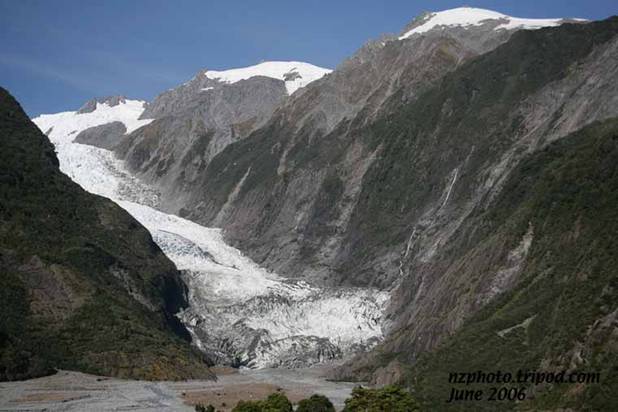
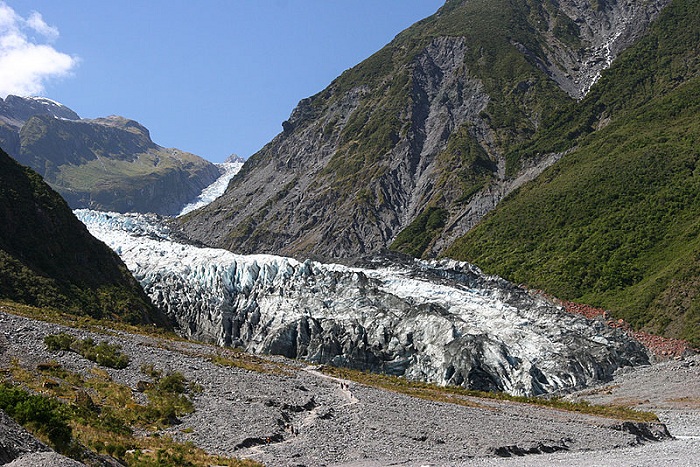
The picture above is a copy of what appeared in The New Zealand Railways Magazine in 1928.
The picture was taken from a 200-foot high hill at about 43.4244 S, 170.1690 E. (Note: If you go any further up the valley, you can’t see the high snow caped mountains in the distance.)
The glacier fills the entire valley.
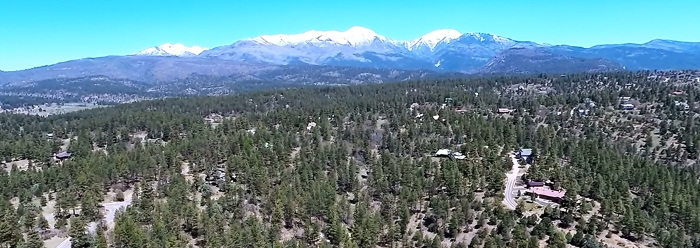
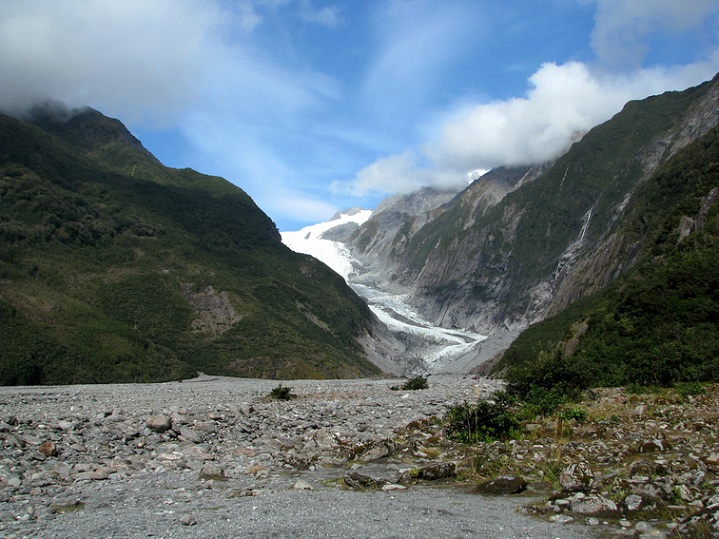
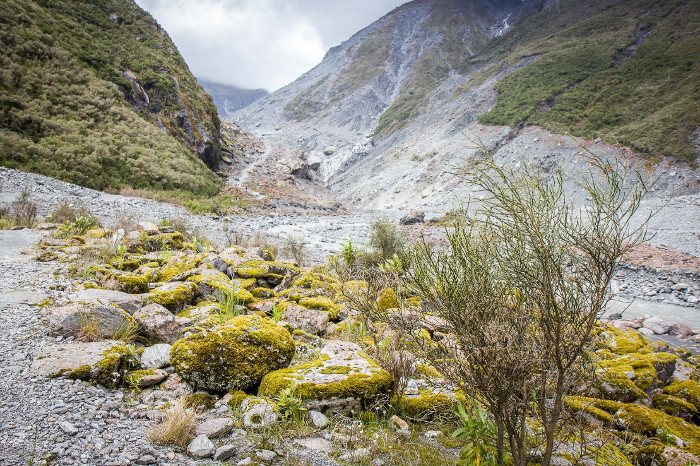
The picture above was taken from the same spot but in 2006. (Photo courtesy of http://nzphoto.tripod.com/south/04Glaciers.htm#2006) The glacier has retreated more than one mile up the valley. In the 1928 picture, a shoulder on the ridge on the left side of the picture is about level with the surface of the glacier. The same shoulder is visible in the 2006 photo. Google Earth lets you measure the elevation of objects. That shoulder on the ridge is now 1,000 feet above the valley floor.
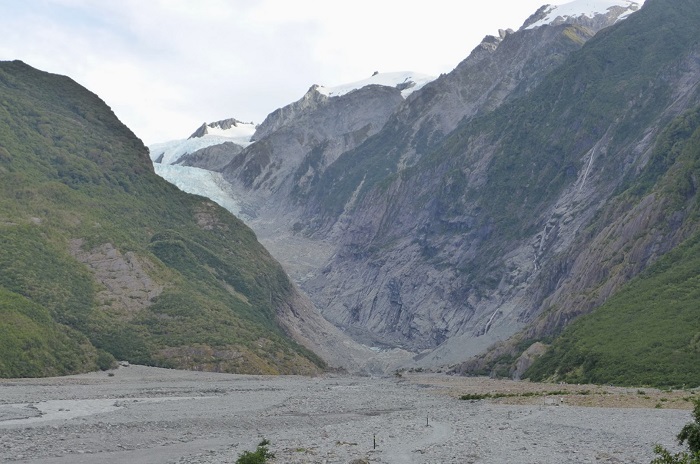
The photo above can be seen at http://www.23hq.com/anjaeichler/photo/6743301? and shows the status of the Franz Josef Glacier as of April 2011. If you compare the lower end of the glacier with the 2006 photo, it’s obvious that the glacier is continuing to shrink.
And finally, here is a 2014 photo showing where the Franz Josef Glacier used to be.
Also please see the “Franz Josef Glacier's 'rapid' retreat (+photos)” article for 2008 vs. 2012 photographs documenting the continued retreat of the Franz Josef Glacier.
The lower end of a glacier is where melting predominates. If a glacier is active, its flow can replace the portion that melts, and the glacier’s front remains approximately stationary. If the flow of ice decreases, then melting takes over. 80 years of melting times a melting rate of 12.5 feet a year will wipe out a 1,000 foot thickness of ice.
The graph above is from Wikipedia . It documents the retreat of the Franz Josef Glacier. Left in the graph shows advanced locations for the glacier’s terminus while the right portion of the graph shows decreased positions. In addition to the overall retreat of the glacier, note that there are minor advances that occur from time to time. If you get a year or two of abnormally heavy snowfall, then the extra mass will cause the Franz Josef or any other glacier to advance for a few years.
These minor random advances are what the Global Warming Deniers claim as “Growing Glaciers”. They are not representative of what is going on, but the Global Warming Deniers are not interested in telling you the real story. They have a political agenda that they are trying to promote, and it doesn’t matter to them that they are not telling the truth. They are only interested in promoting their political agenda - and if what they are saying is actually a complete lie, it doesn’t concern them.
Also, please see:
PHOTOS: Iconic South Island glaciers retreating
Fox Glacier
The Fox Glacier as of March 2, 2007
Source: http://en.wikipedia.org/wiki/File:Fox_Glacier_NZ_2.jpg
The Fox Glacier as of 2016
Source:
Notice anything missing in the 2016 photograph? The bare area on the hillside shows a trimline (green above – bare rock below) as vegetation hasn’t had a chance to grow yet in the area formally scraped bare by the glacier. The Ice Age Now website describes this vanishing act as “Fox Glacier . . . still on the march . . . advancing down their valleys”.
New Zealand’s Largest
Glacier - The Tasman Glacier
The false-color pictures below are from NASA’s Earth Observatory. The Tasman Glacier is New Zealands’s largest glacier. The Hooker Glacier and Mueller Glacier can also be seen. Both the Hooker and Mueller Glaciers are among New Zealand’s 12 largest glaciers.
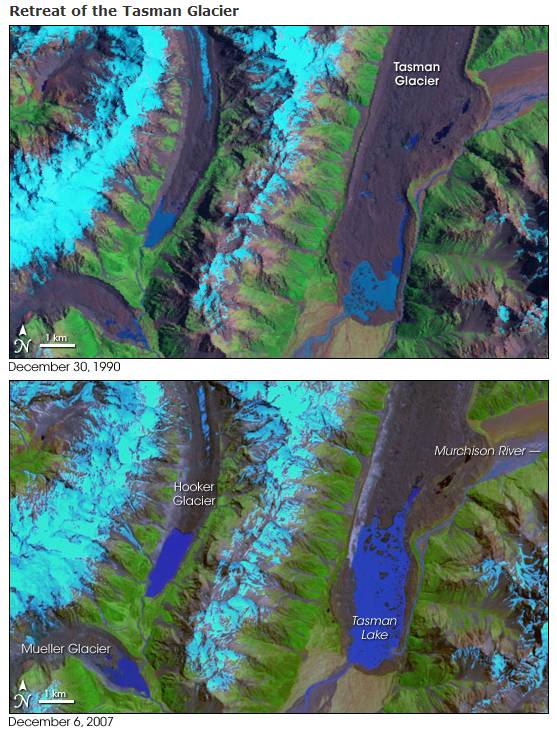
In these false-color images, pale blue indicates ice and snow, dark blue indicates water, green indicates vegetation, and brown indicates rock or bare ground. The lower ends of the three major glaciers are covered by eroded rocks and dirt, and thus appear as a very dark brown.
All three glaciers are retreating from their terminal moraines. As they melt back, lakes form in the basins inside these terminal moraines. The 1990 photograph shows small lakes between the ends of the glaciers and the terminal moraines.
By the time the 2007 photograph was taken, all three glaciers had melted further back. The lakes between the ends of the glaciers and the moraines had expanded significantly in size. As the Tasman Glacier retreats, large dirty icebergs calve off its end, and can be seen floating in its terminal lake.
Q: And how does the “Ice Age Now” website describe these retreating glaciers?
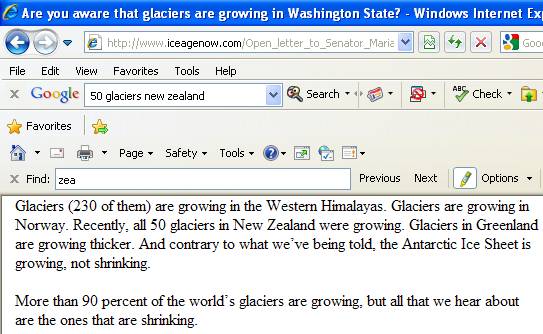
A: “Recently, all 50 glaciers in New Zealand were growing” (See 5th picture below)
Mt. Rainier’s Nisqually
Glacier
One of the most impressive mountains in the state of Washington is Mt. Rainier. Its summit elevation of over 14,000 feet is sufficient to support some two dozen glaciers. (The count has decreased in recent decades.)
 One of these glaciers is the
Nisqually Glacier which is on the south side of the mountain.
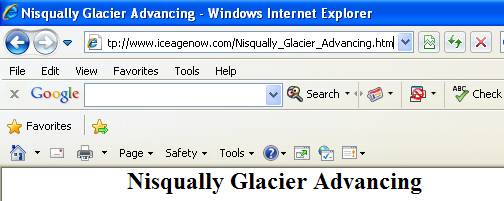
The “Ice Age Now” website states that the Nisqually is
advancing.
One of these glaciers is the
Nisqually Glacier which is on the south side of the mountain.
The “Ice Age Now” website states that the Nisqually is
advancing.As documented below, this claim by the Ice Age Now website is a blatant lie. In reality, like most glaciers in the world, the Nisqually Glacier is retreating. It has melted back about 1 1/2 miles over the last 200 years. This retreat has continued over recent decades.
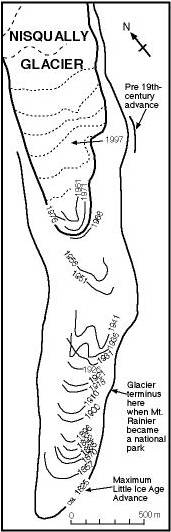 The map to the right appeared in a
research report by:
The map to the right appeared in a
research report by:Stephen C. Porter
Quaternary Research Center
University of Washington
The following description accompanied the map.
“Extent of Nisqually Glacier in 1976 and early in the 19th century during its greatest advance of the Little Ice Age. Glacier terminus positions recorded sporadically between these times are identified by year of observation. Since 1976, the glacier terminus has continued to retreat and now lies well upvalley from its 1976 position. (after Porter, 1981)”
The map also points out the terminus position as of 1997. This is well inside the 1976 boundary. The arrow that points to the 1997 terminus position is of interest. The arrow crosses an inward bend in the edge of the glacier. This bend marks an area where the glacier was pushed to the left by a rock buttress that protrudes from the right hand side of the glacial valley. This rock buttress is an identifying marker that can be matched to photographs. In turn these photographs show what has happened to the Nisqually Glacier’s terminus since 1997.
Repeat satellite photography is a useful tool for documentation of melting/shrinking glaciers. The two views of New Zealand’s Tasman Glacier (shown a few paragraphs up) are just one example. Google Earth has a “clock” tool that lets you view many areas of the earth as photographed at different time periods. This includes the Nisqually Glacier. The two pictures below are vertical views of the Nisqually Glacier - one picture was taken in 1994 and the second in 2009.
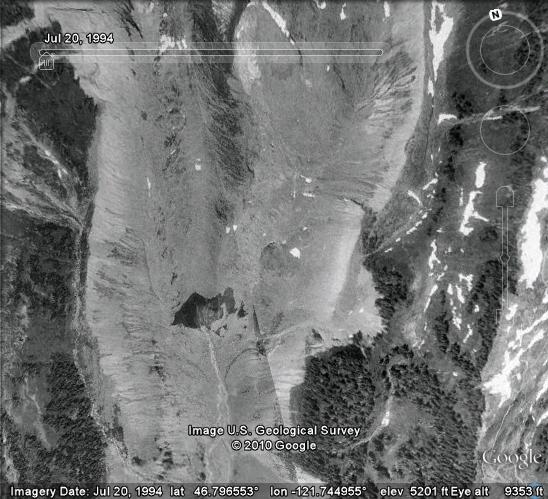
The above black & white picture of the Nisqually Glacier can be seen in Google Earth by activating the “clock” tool and moving the “time slider” all the way to the left. The terminus of the Nisqually Glacier is the dark area (partial shadows - mud covered ice) in the lower left quadrant. A melt water stream can be seen exiting from the base of the glacier with the stream flowing downward off the bottom of the picture.
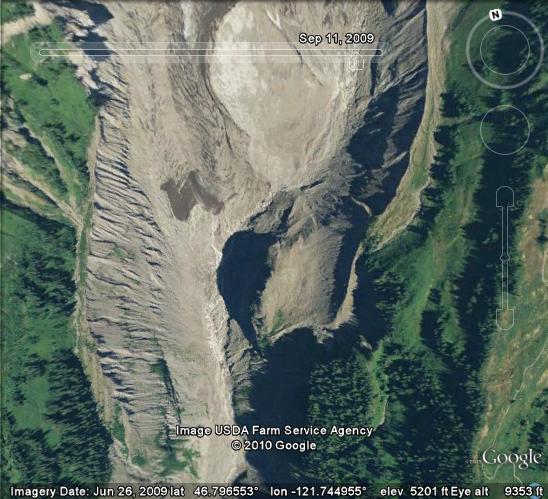
The above picture is viewed from an identical location, but in 2009. The Nisqually Glacier’s terminus is now in the upper left quadrant. The gully slightly above the center of the left edge is useful for comparing the two locations of the terminus. The glacier has shrunk by over 1,000 feet from 1994 to 2009. (In the 2009 picture the sun is off to the right which produces a shadow from the rock buttress - mentioned earlier.)
The tan areas in the 2009 photo shows how much the glacier has melted since the 19th century. 150 years ago these tan areas were buried by the glacier. Since the 1800s, the glacier has melted back over a mile. The tan areas are still bare ground as vegetation hasn’t had enough time to establish itself yet. Also of interest: Note the lateral moraines between the bare areas and the surrounding forest. These ridges of loose rock and sand also mark the extent of the glacier in the 1800s.
The map shows the retreat of the Nisqually Glacier from the 1800s up to 1997, and the photographs show that this retreat has continued up to the present.
And how does the Ice Age Now website describe this retreat?
“Nisqually Glacier Advancing”
If we check a few of Robert Felix’s (the owner of the Ice Age Now website) statements vs. reality, it’s easy to conclude that he is a pathological liar. (For example, see “Medical Dictionary” )
 In an open letter from Robert Felix to
Senator Maria Cantwell, the following statement is made:
In an open letter from Robert Felix to
Senator Maria Cantwell, the following statement is made:“Recently, all 50 glaciers in New Zealand were growing.”
(Please see the NIWA graph below)
If we check with New Zealand’s National Institute of Water and Atmospheric Research, we find that as of 2008:
“Most of New Zealand's glaciers are now the smallest they have been since records began - and they continue to shrink at a rapid rate.
The National Institute of Water and Atmospheric Research, which made the discovery, said global warming was the main culprit.”
http://www.stuff.co.nz/national/627458
(Note, they shrank again in 2009.)
“New Zealand’s glaciers lost significant ice mass again last summer”
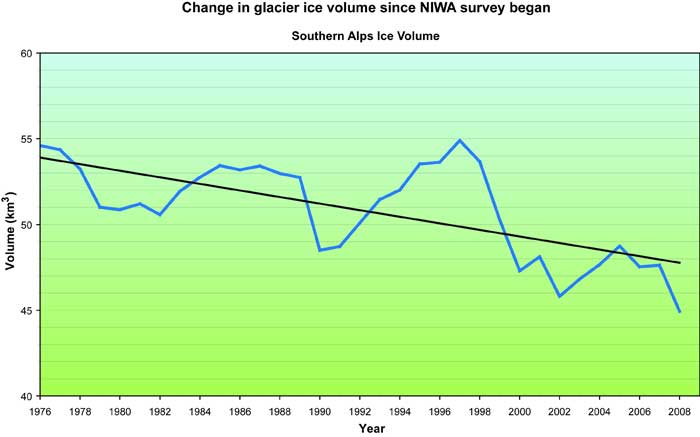
The graph above is from the “Recent Global Glacier Retreat Overview” web page. It shows the volume of New Zealand southern Alps Glaciers as reported by the NIWA. (The referenced web page has good documentation about world-wide glacial retreat.)
Then there is the description seen at the top of the Ice Age Now web page:
“Are you aware that glaciers are growing in Washington State?
One of the U. S. Geological Survey’s benchmark glaciers is Washington State’s North Cascade Glacier. The USGS has a “Glacier Erasure” time lapse video of what has happened to it.
http://wa.water.usgs.gov/projects/glacier/video.html
The two pictures below are from this USGS video.
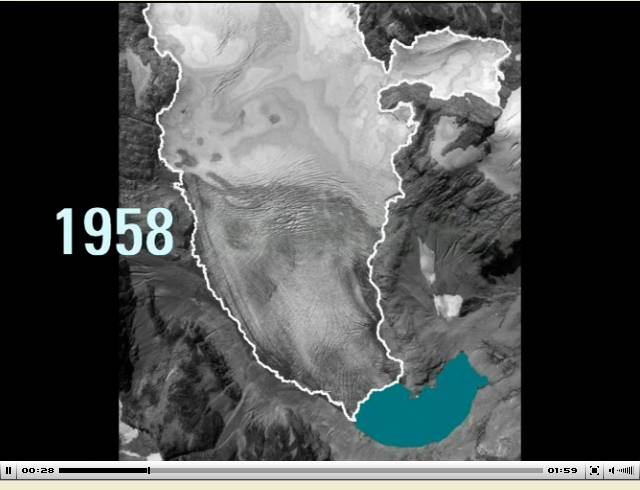
Washington State’s North Cascade Glacier as it appeared in 1958 (above) and what was left of it as of 2006 (below).
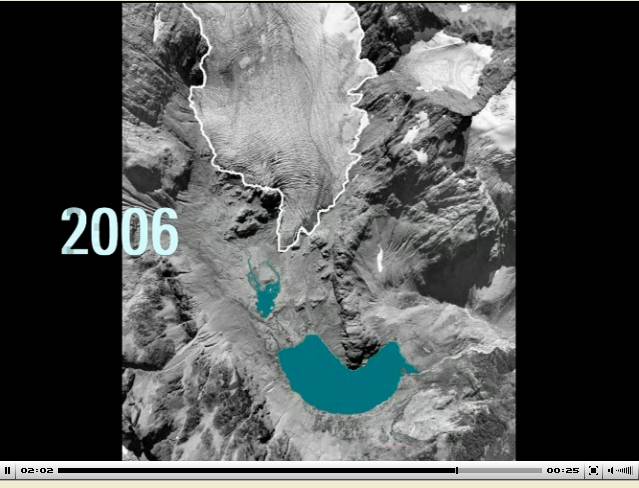
And as noted above, the Nisqually Glacier is located on Mt. Rainier - also in Washington State.
Glaciers in Norway
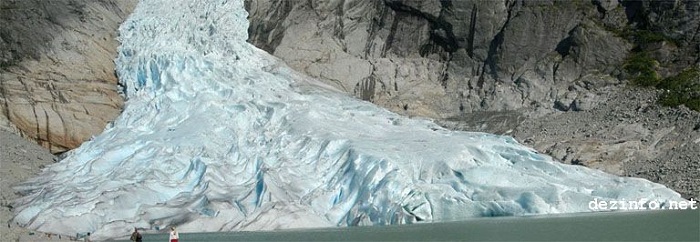
The following photographs show what is happening to Glaciers in Norway.
The first 3 photographs were posted here.
The fourth photograph was taken on Aug. 25, 2011 and can be seen at
http://www.pbase.com/mcrowle/image/137756279 . The four photographs show what has happened to Norway’s Briksdal Glacier since 2001.
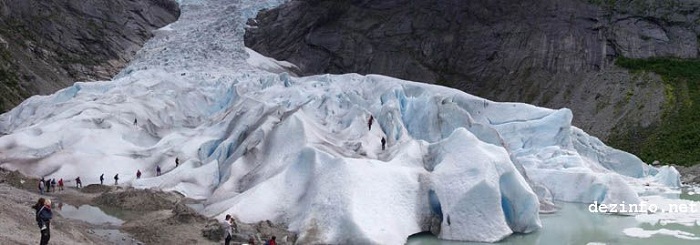
Briksdal Glacier as of 2001
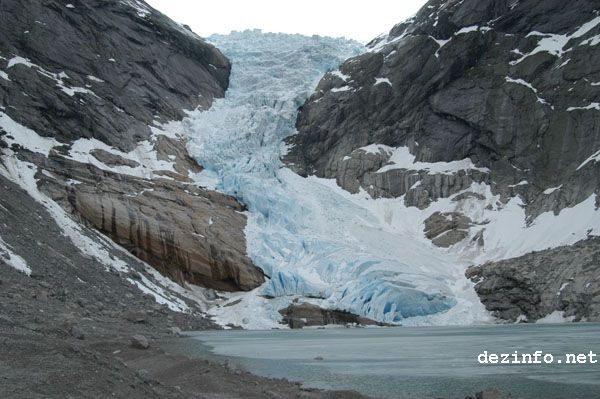
Briksdal Glacier as of 2004
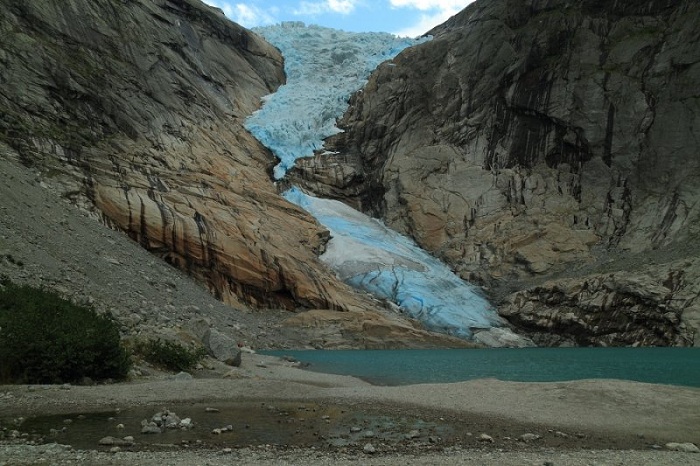
Briksdal Glacier as of 2007
Briksdal Glacier as of 2011
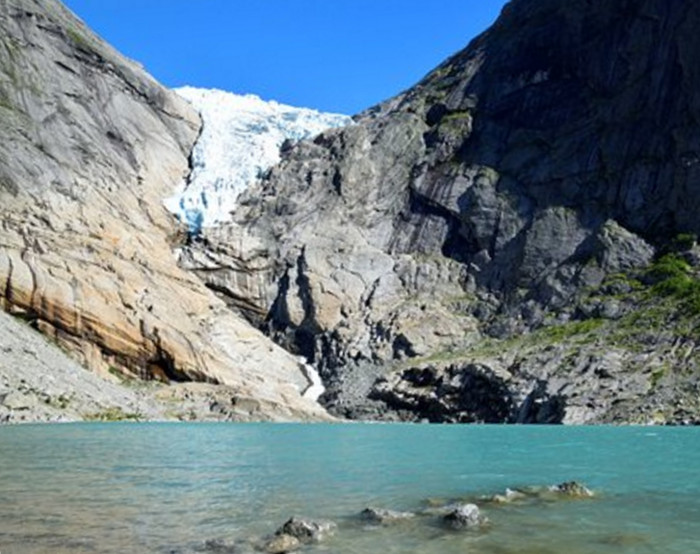
Briksdal Glacier as of 2017
And would you like to make a guess as to how the Briksdal Glacier is classified at the Ice Age Now website?
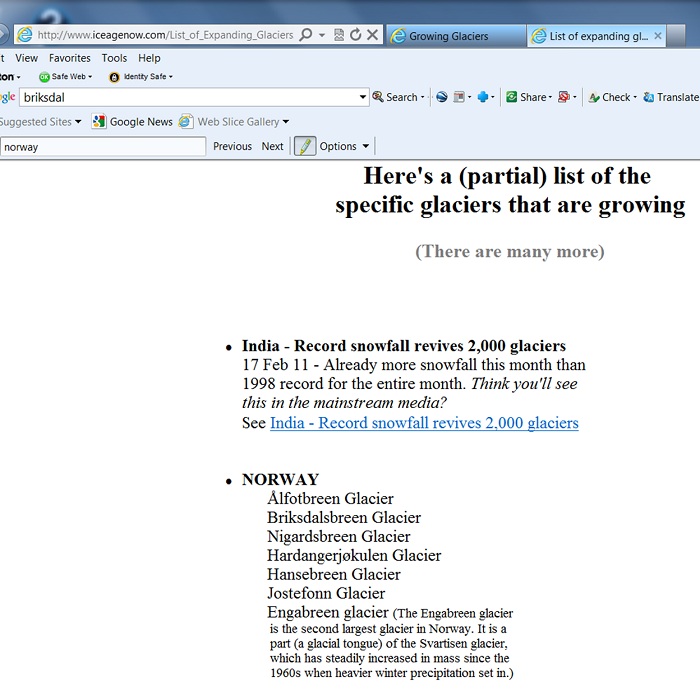
Isn’t it amazing how the Ice Age Now website classifies the Briksdal as a ”Growing Glacier”.
If you check the 2010 “Engabreen Glacier, Norway retreat” report, you will find that:
“From 1999-2009 Engabreen has retreated 255 m.”
“The 2009 position is its point of furthest retreat since the Little Ice Age. The recent retreat indicates a recent trend of negative mass balance on the glacier.”
A quote from “Norwegian mountain glaciers in the past, present and future” (published in ScienceDirect): “Since 2000 most of the observed glaciers have retreated remarkably fast (annual frontal retreat >100 m) mainly due to high summer temperatures.”
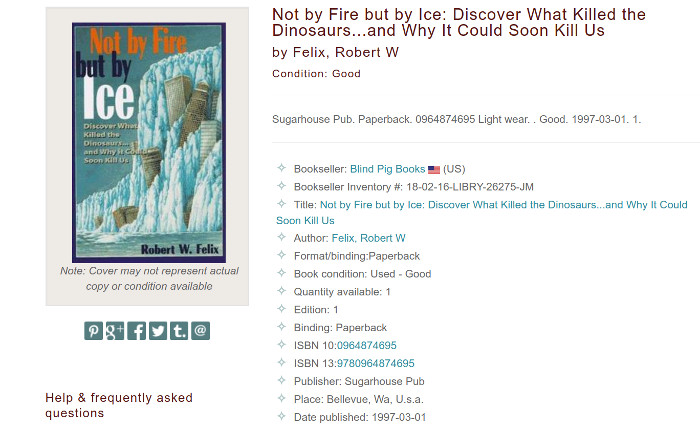
 Then there is Robert Felix's book “Not by Fire but by Ice”.
Since the book was first published in 1997 (see the above
picture), Felix has been trying to convince everyone that a new
ice age was about to start “Any day now”.
Then there is Robert Felix's book “Not by Fire but by Ice”.
Since the book was first published in 1997 (see the above
picture), Felix has been trying to convince everyone that a new
ice age was about to start “Any day now”.Subsequent to the original publishing date in March, 1997, the earth's temperature set a new warmth record for the year ending in Dec. 1997 . . .
1) and then broke the 1997 record in 1998,
2) and then broke the 1998 record in 2005,
3) and then broke the 2005 record in 2010,
4) and then broke the 2010 record in 2014,
5) and then broke the 2014 record in 2015,
6) and then broke the 2015 record in 2016.
For that matter, every year starting with 2001 has been warmer than 1997.
Above data is from NOAA/NCDC.
Source:
How long are we suppose to wait for the new ice age that is due “Any day now”?
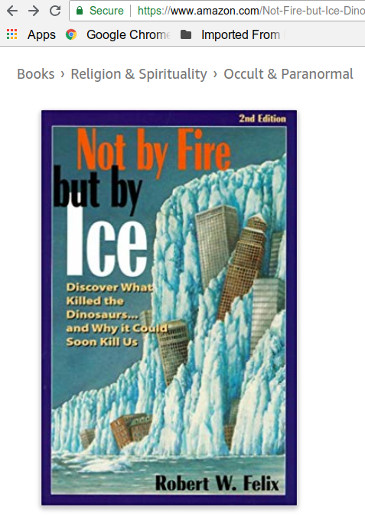
The picture to the right shows Amazon's listing for the 2nd edition of Robert Felix's book. Note the category where the book is listed - “Occult & Paranormal”.
Finally, the U. S. Geological Survey reports that:
There is no doubt that most mountain glaciers are shrinking worldwide in response to a warming climate.
In addition to these three glaciers, more than 99 percent of America’s thousands of large glaciers have long documented records of an overall shrinkage as climate warms
http://www.usgs.gov/newsroom/article.asp?ID=2277
Now, about Robert Felix’s statement that “More than 90 percent of the world’s glaciers are growing” ?
As for Robert Felix’s “knowledge” about climatology, please see (link) for additional information about a certain “eccentric former architect”.
Alternately, please see:
“Is Felix a climatologist, a volcanologist or an oceanographer? Er, none of the above. His biography describes him as a "former architect". His website is so bonkers that I thought at first it was a spoof.”
Return to the main Global Warming Denial Liars main page
Web page generated via Sea Monkey's Composer HTML editor
within a Linux Cinnamon Mint 18 operating system.
(Goodbye Microsoft)